Every Block Covered: Noise and Signal-to-Noise Ratio (SNR) in a 26 GHz 5G Front-End
A prior article in this series explained cascade analysis of noise level, noise floor, bandwidth and signal-to-noise ratio for a simple RF front end with a single gain stage. In this application note, we’ll build on the same concept to guide the designer though calculations for those parameters in a more complex signal chain with multiple non-linear components including a mixer and an IF amplifier. Incidentally, the six-component front end used here by way of example may be applied to the 26 GHz 5G new radio (FR2) band.
5G Down Under: Brief Background
The 24.25 to 27.5 GHz frequency range is also known as the “wider 26 GHz band” or 5G band n258. The Australian Communications and Media Authority (ACMA) “recognized that the wider 26 GHz millimeter wave (mmWave) band was at the forefront of the delivery of mmWave 5G wireless broadband services globally.”2 Consequently, in April 2021, a major portion of that spectrum was auctioned off to operators, predominantly in the 25.1 to 27.5 GHz frequency range.2 The 24.25 to 24.7 GHz band was identified for indoor use and the 24.7 to 25.1 GHz band for indoor/outdoor use.2 For the purposes of the RF front end in this application note, our focus will be on this lower, 24.25 to 25.1 GHz portion of the Australian 5G frequency range.
A Front-End Chain for the n258 Band
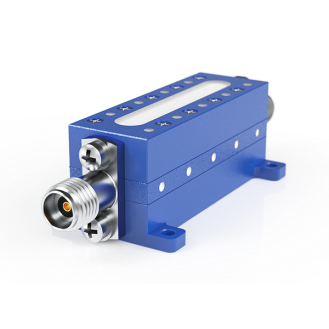
An RF front end capable of covering the 24.25 to 25.1 GHz portion of the 5G n258 frequency band is shown in Figure 1. The design includes an aggressive 5G preselector well suited to the task, followed by a cost-effective, high-performance MMIC LNA. The 3 dB attenuator mitigates any VSWR interactions that may otherwise occur between the LNA and mixer. The mixer itself is capable of LO/RF operation from 10 to 40 GHz, amply encompassing the band of interest. In this application it operates from a 20 GHz LO at +15 dBm, placing the IF band in the 4.25 to 5.1 GHz range. The IF filter is a tiny, ultra-high rejection LTCC filter with a 3 dB bandwidth of approximately 1200 MHz. The IF amplifier is a high-gain, low-noise-figure MMIC which easily covers the 4.25 to 5.1 GHz IF operating band.
The salient features of each of the six components in the block diagram are enumerated below:
- Preselector (ZVBP-25875-K+ cavity filter): 24.25 – 27.5 GHz bandwidth, 1.72 dB insertion loss at 24.25 GHz
- LNA (PMA3-34GLN+): 21.65 dB gain and 1.59 dB NF at 25 GHz
- Attenuator (QAT-3+): 3.15 dB insertion loss at 25 GHz
- Mixer (MDB-44H+): 10.4 dB conversion loss for RF = 25 GHz, LO = 20 GHz and IF = 5 GHz
- IF filter (BFHK-4951+): 2.65 dB insertion loss (5.1 GHz), 3 dB BW approximately 4.1 – 5.3 GHz
- IF amplifier (PMA3-83LNW+): 20.56 dB Gain and 1.59 dB NF at 5 GHz

Noise and SNR
Focusing initially on noise and SNR since they are essentially simpler to manage than NF, we know that the thermal noise floor (PThermal) is:
Where k = Boltzmann’s constant (1.38 x 10⁻²³ J/K), T0 = 290K per IEEE3 and B = Bandwidth (1 Hz)
The next task is to determine the noise floor at each stage of our system, in a 1 Hz BW, as we transition from the RF input to the IF output. This is actually quite simple:
Noise floor (PNoise) in dBm/Hz = PNoise(prev) (dBm/Hz) + Gainc + NFc
where: PNoise(prev) = PNoise of the previous stage, Gainc = cascaded gain, and NFc = cascaded NF
(note: Gainc and NFc include the current stage).
Consequently, after the LNA we have: PNoise = -174.00 dBm/Hz + 19.93 dB + 3.31 dB = -150.76 dBm/Hz. The results of these calculations for each stage are shown in the tabular portion of Figure 2.
PNoise (dBm/BW) shown in Figure 2 is a way of expressing the noise floor in a system of a bandwidth other than 1 Hz. In other words, it accounts for the increase in noise power with increasing system bandwidth. Initially, the preselector limits the noise bandwidth to 3.25 GHz, corresponding to a noise floor of -78.88 dBm. Wait, what just happened? The thermal noise floor (PThermal), which is referenced to just 1 Hz, was adjusted for a 3.25 GHz system as follows:
Noise floor (PNoise (dBm/BW)) = -174 dBm/Hz + 10log(BW (Hz)) + Gainc + NFc = -174 + 10log(3.25 x 10⁹ Hz) -1.72 + 1.72 = -78.88 dBm
The same result can be achieved by considering that PNoise (dBm/BW) = PNoise (dBm/Hz) + 10log(BW (Hz)). The noise floor in a 1 Hz BW is simply being adjusted for the system bandwidth.
In the first equation for noise floor in the system bandwidth, notice that the insertion loss of 1.72 dB in the ZVBP-25875-K+ preselector cancels the NF. It is just a single, passive component at that point in the system. In essence, we know that the insertion loss of the preselector cannot attenuate the thermal noise floor (PThermal) below the -174 dBm/Hz level, so the fact that insertion loss and NF fall out of the equation is natural.
If we define an input signal level of -10 dBm, which won’t compress the IF amplifier, we can easily determine the signal-to-noise ratio (SNR) after the preselector in dB as:
SNR (dB) = 10log(Signal (mW)/PNoise (mW)) = 10log(Signal (mW)) – 10log(PNoise (mW)) = Signal (dBm) – PNoise (dBm) = -11.72 dBm – (-78.88 dBm) = 67.16 dB.
This SNR is shown in the tabular portion of Figure 2 in the column following the preselector (post stage 1). Note that the RF input signal level of -10 dBm is attenuated by the insertion loss of the preselector (1.72 dB) in the calculation, and that the system bandwidth determines PNoise. For subsequent stages, the signal simply undergoes gain or loss, but several factors can affect the noise power, PNoise. The gain/loss and noise figure (NF) of a component such as an amplifier will affect the noise floor directly. Additionally, any system bandwidth changes will most certainly have an effect on the noise floor of the system, just as the preselector bandwidth of 3.25 GHz led to a far different and far greater PNoise level than PNoise in a 1 Hz bandwidth.

There is one anomaly in the calculations which occurs quite often when receiver front ends include the conversion to IF frequency. The preselector sets the system bandwidth to 3.25 GHz (24.25 – 27.5 GHz), which remains in effect until the IF filter makes a significant change to the system BW. The BFHK-4951+ reduces the system bandwidth to 1.2 GHz (4.1 – 5.3 GHz). The effect of this bandwidth change can be seen in the PNoise (dBm/BW) entry that occurs post stage 5. With no bandwidth change, the previous equation yields:
PNoise (dBm/BW) = PNoise (dBm/Hz) + 10log(BW (Hz)) = -166.19 dBm/Hz + 10log(3.25 x 10⁹ Hz) = -71.07 dBm in a 3.25 GHz bandwidth.
However, to achieve the correct result, one must take into account the fact that the IF filter has reduced the system bandwidth from 3.25 GHz to 1.2 GHz:
PNoise (dBm/BW) = PNoise (dBm/Hz) + 10log(BW (Hz)) = -166.19 dBm/Hz + 10log(1.2 x 10⁹ Hz) = -75.40 dBm in a 1.2 GHz bandwidth.
Note that the reduction in system bandwidth naturally leads to a reduction in PNoise.
Cascading Gain and Noise Figure
The gain and noise figure of the first stage are simple, they are precisely the insertion loss of the ZVBP-25875-K+ preselector (1.72 dB), negative for gain and positive for NF.
What happens when an LNA, attenuator, mixer, IF filter, and an IF amplifier are cascaded in series with the preselector? Examining the parameters that follow each of the stages in the tabular portion of Figure 2, the cumulative gain after each stage is determined by simply adding that stage’s gain to the cumulative gain at the preceding stage. In other words:
Gcum(n) = Gn-1 + Gn.
In the case of the entire six-component cascade:
GTot (dB) = G1 + G2 + G3 + G4 + G5 + G6 = -1.72 dB + 21.65 dB – 3.15 dB – 10.40 dB – 2.65 dB + 20.56 dB = 24.29 dB.
Noise figure is a significantly more complex parameter to cascade throughout a front end and requires that noise figure (NF) in dB be converted to noise factor (F) and run through Friis’ formula for noise factor (F).4 In the case of the first two stages (preselector/amplifier), the noise figure (NF) of each stage can simply be added together in dB (1.72 dB + 1.59 dB = 3.31 dB), the result of which is shown in the “Post Stage 2” column in Figure 2. Once gain is introduced, and an element follows that gain in the signal chain, Friis’ formula is used as shown below:
FTotal = F1 + (F2 – 1)/G1 + (F3 – 1)/G1G2 + (F4 – 1)/G1G2G3 + (F5 – 1)/G1G2G3G4 + (F6 – 1)/G1G2G3G4G5
…and to convert to noise figure: NFTotal = 10log(FTotal).
Alternatively, Friis’ formula can be used one stage at a time, so that a running total of the NF appears for each added component in the system.
Noise factors are determined according to the formula, F = 10(NF/10) so that:
F1 = 10(1.72 dB/10) = 1.49
F2 = 10(1.59 dB/10) = 1.44
F3 = 10(3.15 dB/10) = 2.07
F4 = …
The gain (Gn) is the cascaded gain up to the point where element associated with Fn+1 enters the system. Gain must also be a linear ratio: (e.g. G1 = 10(21.65 dB/10) = 146.22).
Signal-to-Noise Ratio (SNR)
Having already performed the heavy lifting, the SNR can be determined by simple subtraction of two values in dBm: the signal level and the noise level in the system bandwidth, expressed as dBm/BW in Figure 2. In every instance in Figure 2, the SNR can be determined for any stage by computing:
SNR = Signal level (dBm) – PNoise (dBm/BW)
Cascading Effect
This article provided brief explanation of cascade analysis for noise and signal-to-noise ratio in a six-component RF front end designed for the 5G n258 band from 24.25 To 25.1 GHz. Step-by-step calculations for thermal noise floor and noise floor at a given system bandwidth and the signal-to-noise ratio (SNR) were shown. Friis’ formula was used to compute cascaded noise figure. Signal level was simplified by starting at -10 dBm, and computation of noise level (including an explanation of the effect of the system bandwidth change) and SNR were performed using cascaded gain and NF values. Future articles in this series will address additional cascaded parameters such as linearity in terms of P1dB and IP3 for a similar front-end design.
Products Used in This App Note
References
- RF Front End, Wikipedia
- Australian Communications and Media Authority (ACMA), Australian Government, Auction Summary – 26 GHz Band (2021), last updated: 03 March 2022
- Receiver Sensitivity/Noise
- Friis formulas for noise – Wikipedia


