Extending Power and Dynamic Range in E-Band Backhaul Test Sets
Background
According to Ericsson’s 2022 Mobility Report, global mobile data traffic is expected to grow by a factor of 4 to 325 Exabytes total per month or 46 GB per smartphone on average by 2028, excluding Fixed Wireless Access usage.1 Network operators’ ability to support this rapid growth in consumption hinges on the speed and capacity of the backhaul systems connecting base stations to the core networks. Accordingly, the market for cellular backhaul equipment is projected to grow by 12.6% CAGR from 17.85B to 32.29B USD between 2020 and 2025. Looking more narrowly at E-Band systems still in nascent stages of development, that growth rate jumps to 22.3% (534M to 1.46B over the same period).1
Backhaul systems transmit signal traffic from network nodes to aggregation points via either fiber-optic cable runs or point-to-point (P2P) microwave radio links. Operators have historically faced a tradeoff between the superior speed and capacity of fiber versus the lower cost, faster deployment and greater flexibility of wireless backhaul. P2P links in the E-Band range (71 to 76 and 81 to 86 GHz) have become a popular solution to increase data rates without the heavy investment in land use and construction required for fiber.
As a general benchmark, recall that for a binary modulation scheme, the theoretical maximum data rate of a channel with B Hz of bandwidth is 2B bits per second. Modern fiber-optic cable can support data rates on the order of 1 to 10 Gbps, depending on the type of cable, distance of the run and other factors. A wireless link would therefore need about 0.5 to 5 GHz of bandwidth to achieve comparable data speed. Operation in the E-Band range allows system designers to achieve nominal bandwidths in this range at lower fractional bandwidths without restrictions on transmission due to spectral crowding at lower, more established frequencies.
On a practical level, implementing these systems presents several challenges, not least of which is the problem of building test setups well above the range of industry-standard network analyzer equipment which typically operates below 67 GHz. This article will outline two of the most common difficulties test operators face in performing measurements for E-Band devices. A use case for each of these scenarios is provided by way of demonstration, each incorporating a different Mini-Circuits E-Band amplifier to overcome inherent limitations of typical millimeter-wave test setups. Measurements from actual test setups in the lab at Mini-Circuits’ Deer Park Technology Center are presented in each case to validate the amplifiers’ effect on system performance.
Test Requirements for E-Band Wireless Backhaul
Test equipment currently available from major OEMs generally has a native upper frequency limit of 67 GHz. E-Band test setups use a frequency extender module between the VNA and the device under test (DUT) to convert between the VNA frequency range and the application band of interest. On the transmit path, the output from the extender often falls well short of the required signal power for product evaluation testing. This deficit is compounded by the inherent loss of millimeter [1] wave signals passing through adapters and cables before the DUT, as well as any switches or splitters used to distribute signal to multiple test fixtures in larger setups. An external driver amplifier is therefore needed to generate the necessary power.
On the receive side, the minimum discernable signal is set by the noise floor of the receiver, and incoming signals from a broadcasting device are often too small for the instrument to measure. A low noise amplifier can be used at the front end to boost small signals into the usable dynamic range of the instrument. Because the LNA amplifies desired signal and noise alike while contributing additional noise (characterized by the noise figure of the device), a suitable amplifier must not only have sufficient gain, but also low noise figure and good dynamic range itself to minimize any effect on the overall quality of the measurement system.
The unique challenges of designing and building amplifiers with suitable wideband performance in the E-Band range has resulted in a limited pool of options on the market, particularly for engineering test users where lack of in-stock availability can mean adding as much as 6 months of turnaround time to development timelines. Mini-Circuits has introduced a series of amplifiers specifically designed to meet the needs of these test systems with in-stock availability. The cases that follow demonstrate the use of two models in this series to augment output power and extend receiver dynamic range in E-Band test sets.
A Driver Amplifier for E-Band Source Power Extension
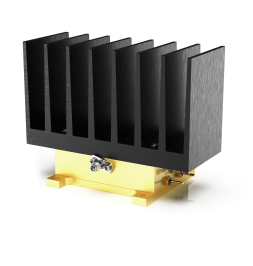
E-Band Medium Power Amplifier
Key Features:
- 71 to 86 GHz
- 38 dB gain
- ±1.5 dB gain flatness
- +24 dBm PSAT
As discussed, testing at higher frequencies often requires additional drive power beyond what a typical test setup with frequency extenders can provide. For example, if an E-Band amplifier chip under test has 15 dB of gain and a P1dB of +25 dBm, a typical frequency extension test set with 0 dBm output power will not be able to drive the DUT to compression. In this case, the dynamic range of the source can be extended using additional amplification. The following example demonstrates the source power extension achievable when using the Mini-Circuits ZVA-71863HP+ with Keysight’s N5293AX03 frequency extenders.
First, the analyzer was fully calibrated, and the available source power was recorded by connecting port 1 to port 2 and plotting the power at the “B” receiver. Roughly +2 dBm was available from the source over the 71 to 86 GHz range in this configuration.
![Extending Power and Dynamic Range in E-Band Backhaul Test Sets 3 Figure 1: Sweep of leveled source power from N5293AX03 frequency ex[1]tender around +2 dBm over the 71 to 86 GHz band.](https://www.mcdi-ltd.com/wp-content/uploads/2023/07/fig-1.webp)
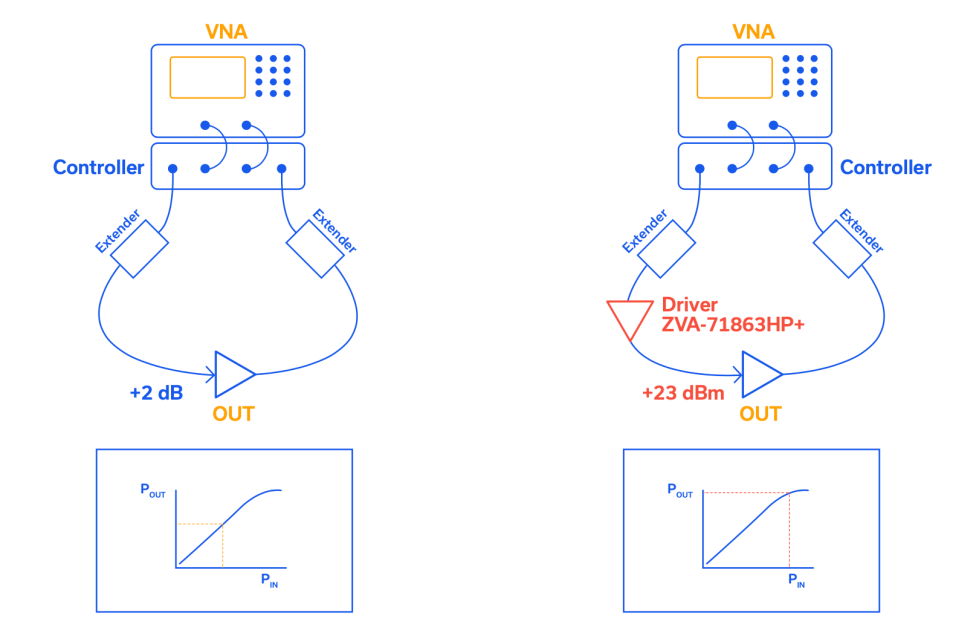
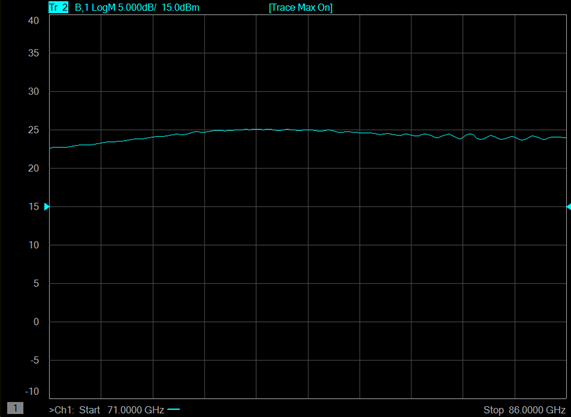
Next, the ZVA-71863HP+ amplifier was added on port 1 and allowed to stabilize in temperature. Repeating a similar measurement now shows a peak of +25 dBm source power available at the amplifier output. A simple block diagram of the test setup is shown in Figure 2. The measurement plot for output power from the amplifier is shown in Figure 3.
While it may be useful to achieve a higher local power, a source power calibration can also be run in this configuration to achieve a constant output power over the full 71 to 86 GHz band. In this case, the power was leveled at +23 dBm (the minimum achievable output power from the amplifier over the full band of interest), as shown in Figure 4.
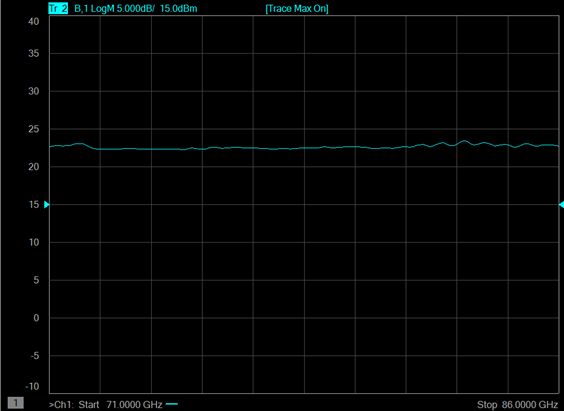
hus, a DUT can now be tested with up to +23 dBm of output power from the source from 71 to 86 GHz. In the previous example of the amplifier chip, this provides more than enough source power to drive the DUT with 15 dB of gain and a P1dB of +25 dBm into compression.
A Low Noise Pre-Amplifier to Enhance Receiver Sensitivity
Conversely, when receiving and measuring very low-level signals, it is common to use pre[1]amplification to increase the receiver sensitivity of the measurement system. In this case, a low noise amplifier is placed after the DUT in the receiver chain and effectively provides signal amplification while adding as little noise as possible to the system.
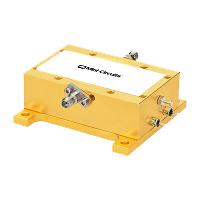
E-Band Low Noise Amplifier
Key Features:
- 71 to 86 GHz
- 37 dB gain
- ±1.5 dB gain flatness
- 4.5 dB noise figure
For example, the noise floor of Keysight’s N5293AX03 frequency extenders is advertised to be -112 dBm (typical). If a very low-level signal is received at -120 dBm, it will be lost in the noise floor of the system thus making measurements impossible. However, if we use the Mini-Circuits ZVA-71863LNX+ amplifier for pre-amplification, the low-level signal will be amplified and can be accurately distinguished. The following example demonstrates this improvement in receiver sensitivity.
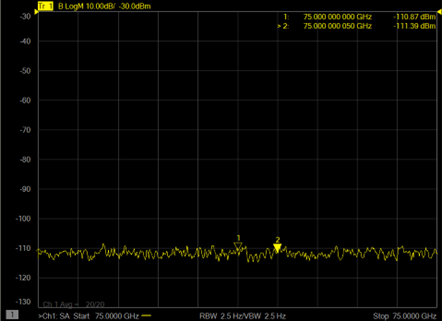
First, the analyzer was fully calibrated and a single tone at -120 dBm was established at the output of the source. This was achieved by generating a measurable, -60 dBm tone at 75 GHz and then adding a calibrated, 60 dB attenuator after the source. The resultant measurement on the spectrum analyzer (Figure 5) does not show the tone, because it is below the noise floor of the measurement system. Note that the noise floor is very close to the advertised -112 dBm typical value.
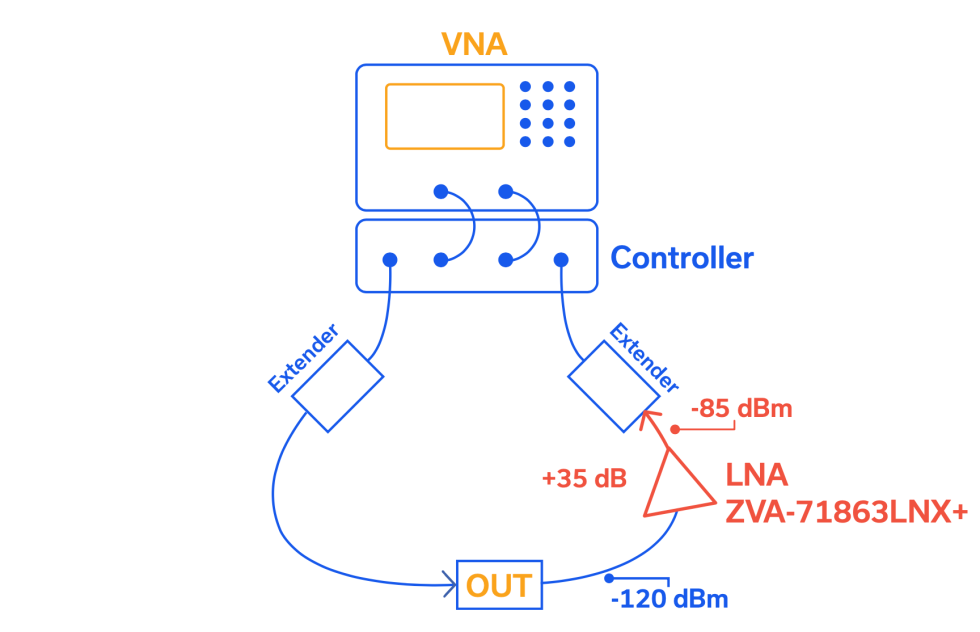
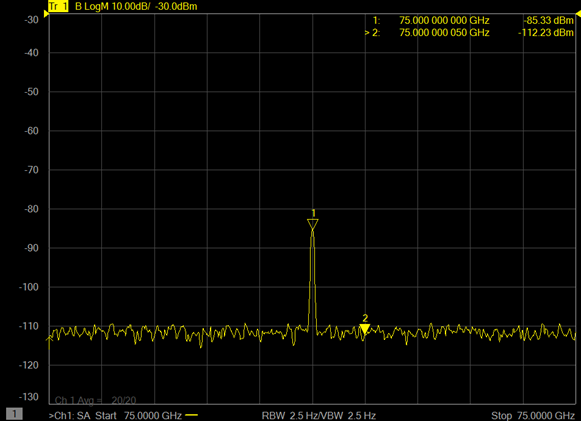
Next, the Mini-Circuits ZVA-71863LX+ was added on the receiver port. This amplified the signal by the gain of the amplifier, which in this case was approximately 35 dB at 75 GHz. The same -120 dBm input signal was generated at the source. The resultant measurement at the receiver clearly shows the tone, at a power level of approximately -85 dBm (-120 dBm input + 35 dB gain = -85 dBm measured).
Note that the noise floor of the measurement has not changed. Because..
-174 [dBm/Hz] + 10LOG(RBW[Hz]) + GAIN[dB] + NF[dB]
…is still below the noise floor of the test set, the addition of the gain and noise figure of the amplifier in the bandwidth of measurement (10log(RBW[Hz]) has no discernable effect on the sensitivity of the receiver. There is a distinct tradeoff between the noise figure and amount of gain added in the pre-amp. To add a high level of signal amplification (and therefore be able to resolve lower-level signals), it is critical that the noise figure remain as low as possible.
A simple block diagram of the measurement setup used in this example is shown in Figure 6, and the resulting measurement plot is shown in Figure 7.
The addition of ZVA-71863LNX+ as a pre-amplifier therefore effectively allows measurement of input signals well below the system noise floor without degrading the overall noise figure of the system. This model achieves a unique combination of high gain (37 dB typical) with ±1.75 dB flatness and low noise figure (4.5 dB typical), making it ideal for wideband measurements of low-level E-Band signals like the one demonstrated here.
Versatility, Ease of Use and In-Stock Availability
The use cases demonstrated in this article are common practice in the industry for a wide variety of test applications across the frequency spectrum. The unique challenges in E-Band testing stem from the effects of connecting a frequency extender module to the VNA, the lossy characteristics of millimeter-wave signals, and the availability of amplifiers capable of supporting such applications. Mini-Circuits developed the ZVA-71863HP+ medium power amplifier and ZVA-71863LNX+ low noise amplifier targeting the desired performance for E-Band test applications from bench-level component testing to high-throughput chipset testing in production environments. These are only two examples among Mini-Circuits’ growing portfolio of connectorized amplifiers and other components up to 95 GHz at the time of writing.
Mini-Circuits’ E-Band amplifiers are designed for ease of use with single supply voltage, no sequencing required, and extensive built-in DC protection to prevent damage from mishandling. All models are available from stock, saving weeks otherwise spent waiting for production turnaround time as many suppliers don’t maintain stock due to the high cost of production for these products.
The table below summarizes Mini-Circuits’ current portfolio of amplifiers for V- and E-Band test applications. Additional high-frequency amplifier models covering Ku- through Ka-Band frequencies with output power up to 1W are also available from stock but not shown since they fall outside of the scope of this article. Designs with waveguide interfaces and coverage up to 110 GHz are also in late-stage development to support over-the-air testing. We continuously review our development pipeline to align with customer demand. If you have questions about our catalog, models in development or a specific requirement for your test application, please contact us to discuss your needs with our engineers.
V – E-Band Connectorized Amplifiers in Stock
| P/N | Freq Range (MHz) | Gain (dB) | NF (dB) | P1dB (dBm) | OIP3 (dBm) | Voltage (V) | DC Current (mA) | Connector Type | Option |
|---|---|---|---|---|---|---|---|---|---|
| ZVA-50953G(X)+ | 50000-95000 | 28 | - | 17 | - | 10 | 370 | 1.0mm | Heat Sink |
| ZVA-50953X+ | 45000-95000 | 17 | - | 14 | - | 10 | 140 | 1.0mm | - |
| ZVA-71863HP+ | 71000-86000 | 37 | - | 22 | - | 10 | 490 | 1.0mm | Heat Sink |
| ZVA-71863LNX+ | 71000-86000 | 37 | 4.5 | 13 | - | 10 | 180 | 1.0mm | - |
| ZVA-5803X+ | 500-80000 | 17 | 5 | 10 | 23 | 10 | 130 | 1.0mm | - |
| ZVA-35703+ | 35000-71000 | 17.5 | - | 19.5 | 28 | 15 | 210 | 1.85mm | Heat Sink |


