Group Delay in RF Filters
The concept of group delay as it pertains to RLC networks was first described by Harry Nyquist in 1928.1 The contributions Nyquist made to the field of Communications Theory are well known,2 and still applicable to modern day communications systems. On our way toward understanding group delay in this brief application note, we’ll start by examining phase delay. After mathematically defining phase delay, we will then continue by defining group delay. Illustrations of amplitude response, and phase and group delay response for several ideal filters of various filter topologies are shown. This app note concludes with a display of magnitude and group delay frequency response curves for two real filters designed and manufactured by Mini-Circuits, both of which have the same filter topology.
Diving in Phase First
Our first order of business is to understand the phase of an electronic system. For the discussion that follows, we assume that the system is linear and time-invariant (LTI). A linear system’s behavior can be modeled as a linear function, and the output of a time-invariant system does not depend on when the input was applied.3 A phase response that changes as a function of frequency is common in audio devices such as microphones, amplifiers, and speakers. Regarding RF systems, components such as coaxial cables, active RF devices, and many types of RF and microwave filters all have changing phase responses.4,5 The reason a varying phase response is so critical is that both phase delay and group delay can be calculated from the phase response of a system or circuit. In the following section we’ll examine some basic mathematical properties of phase delay and group delay and explore how those properties relate to the phase response of an LTI system.
Phase & Group Delay
Phase delay in units of time relates to the phase response in angular units (degrees, radians) insofar as phase delay equals the negative of the phase shift at a given frequency divided by that frequency.4 On the other hand, group delay is the negative derivative of the phase shift with respect to frequency.
Mathematically, therefore:6
Phase Delay (tp)
Group Delay (tg)
tp = —Ang[H(ω)]/ω
tg = —d{Ang[H(ω)]}/dω
Where H(ω) is the frequency response of the phase of the system.
It is typical to calculate and plot both the amplitude and phase response of RF systems, and RF filters often exhibit interesting phase response characteristics, which result in impressive group delay response curves. In the next section we examine several ideal filter topologies and plot their phase and group delay response curves.
Ideal Bandpass Filter Frequency Response Characteristics
Several characteristics of bandpass filters need to be taken into account when designing an RF system. Passband ripple, slope of the roll-off outside the passband, and in-band phase response are just a few. Figure 1 shows schematics for three 5th order, 100 MHz bandpass filters with a 20 MHz BW, and each filter sharing the same topology. Note that the 0.1 dB Chebyshev and the Butterworth are symmetric about the center leg’s shunt pair while the Bessel filter is not.


Figure 1: Schematics for ideal 0.1 dB Chebyshev (top), Butterworth (middle) and Bessel (bottom) 100 MHz bandpass filters.
As the elements in the circuit are lossless, the frequency responses shown in Figures 2 and 3 can be considered more or less ideal. As expected, the 0.1 dB Chebyshev has the steepest amplitude roll-off, and consequently the greatest phase slope across the passband. The Butterworth exhibits a gentler response with less roll-off and less phase slope, and the Bessel filter has the most gradual roll-off and the least phase slope. Note also that the phase response across the passband for the Bessel filter is linear. This filter type is often referred to as a “linear phase” or “constant delay” filter, and it is named after German mathematician Friedrich Bessel who developed the theory behind it in the early 1800s7. Bessel’s theory was first applied to filter design in 1949 by W.E. Thomson.8
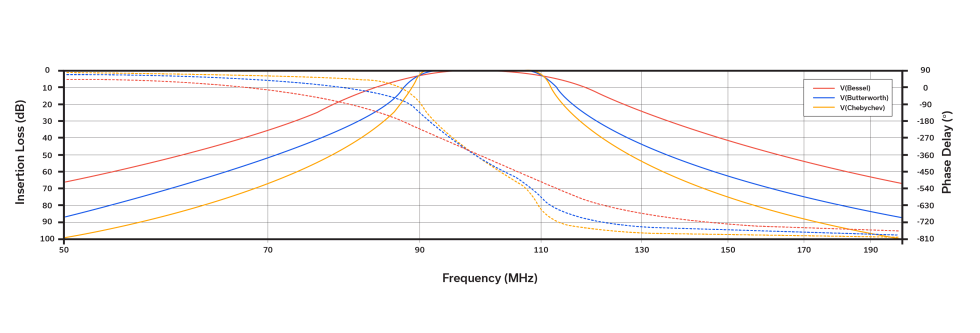
Figure 3 shows the same amplitude response for the three different style filters as Figure 2, but plotted alongside group delay instead of phase. While this application note does not propose to solve for the derivative of the mathematical formula for the group delay of a 5th order bandpass filter, the comparison between the phase response curves of Figure 2 and the group delay for the filters in Figure 3 is worthy of qualitative study. Recall from the general formulas for phase and group delay that group delay is defined as the negative derivative of the phase response of a given RF system.
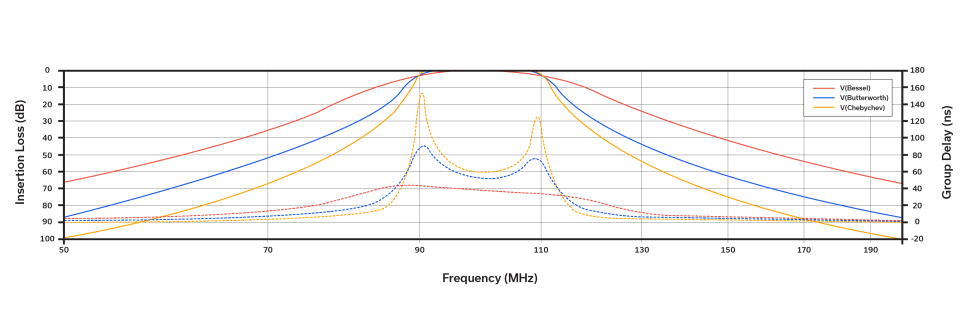
When analyzing the 0.1 dB Chebyshev filter and the Bessel filter, which represent the two extremes, notice how the derivative (rate of change of) the phase response is reflected in the group delay for each filter. For the 0.1 dB Chebyshev filter, the group delay peaks where the slope of the phase response hits its two maxima (at approximately the 3 dB points). With the Bessel filter, the phase response is so linear that its rate of change with respect to time (derivative) is nearly constant. The Butterworth response falls on the continuum between the Chebshev and Bessel responses.
Real Bandpass Filter Frequency Response
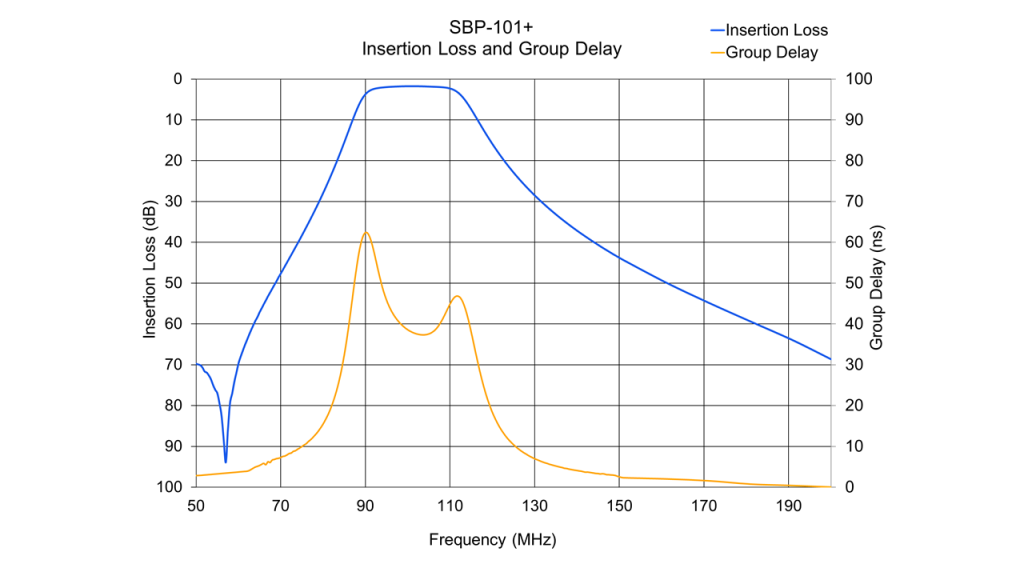
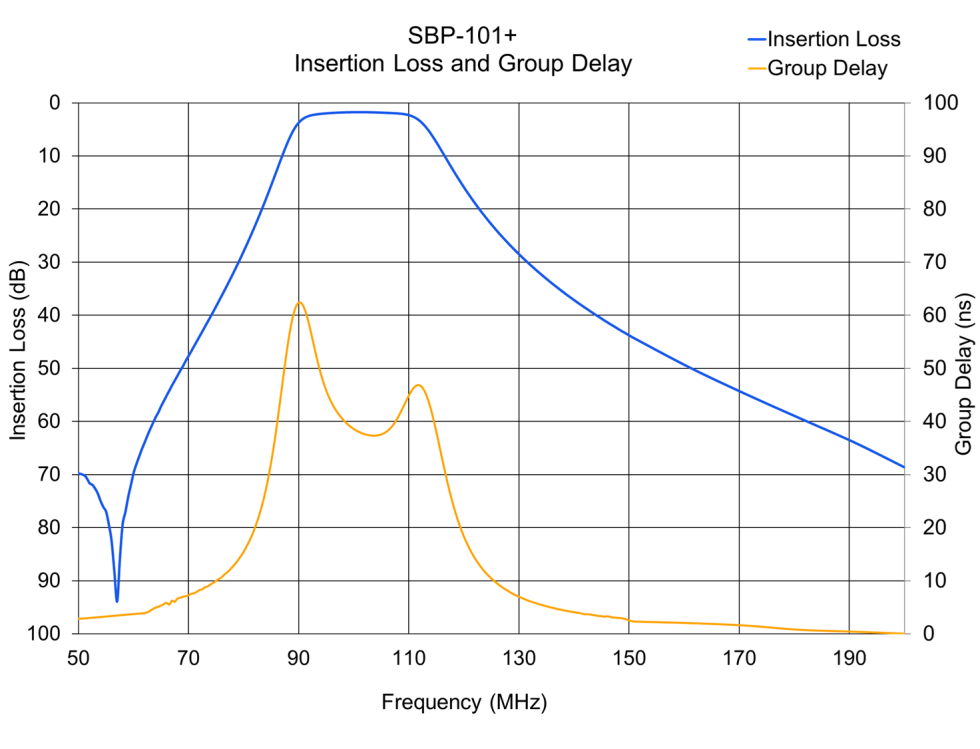
Insertion loss and group delay for the Mini-Circuits SBP-101+ physical bandpass filter, similar in passband to the ideal filters shown above, is plotted in Figure 4. Observe that the righthand Y-axis labels are positive, since we are referring to this parameter as insertion loss. Over the 94-108 MHz passband specified on the filter data sheet, this component maintains a peak-to-peak group delay variation of approximately 12 ns (spanning 37 to 49 ns), very flat group delay performance for a filter with such steep skirts and high out-of-band rejection. The SBP-101+ is a tuned, lumped element filter with SMA connectors, and its companion filter, the Mini-Circuits’ BBP-101+, shares nearly identical frequency response characteristics while sporting BNC connectors. Mini-Circuits designs, manufactures and customizes many other types of filters, from tiny LTCC and MMIC filters to suspended substrate stripline and even waveguide filters.
Without Further [Group] Delay
This application note reviewed the amplitude and phase response for an electronic system, with an emphasis on phase. It provided basic equations to show how both phase delay and group delay can be derived from the phase itself. Schematics and frequency response curves charted three bandpass filter types (Chebyshev, Butterworth and Bessel), and the application note also includes a qualitative discussion of how phase directly relates to group delay. The frequency response for insertion loss and group delay was shown for a physical Mini-Circuits’ filter, the SBP-101+, and the breadth of Mini-Circuits’ portfolio of filters was discussed. To explore that portfolio, follow this link: Access the Mini-Circuits’ filter portfolio.
References
- a-127.pdf (hparchive.com)
- Harry Nyquist – Wikipedia
- Linear Time Invariant Systems | Brilliant Math & Science Wiki
- Group delay and phase delay – Wikipedia
- AES E-Library » Phase Distortion and Phase Equalization in Audio Signal Processing-A Tutorial Review
- Group Delay and Phase Delay – YouTube
- Friedrich Wilhelm Bessel – Wikipedia
- Bessel filter – Wikipedia


