A Short Primer on RF / Microwave Power Sensors
Versatile, Affordable Power Measurement Solutions to 40 GHz
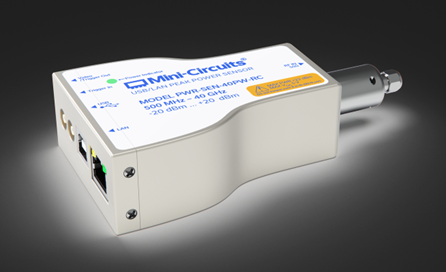
Proper power measurement techniques are important for achieving accurate results. Mini-Circuits’ PWR-series of smart power sensors now furnishes the measurement professional with the ability to make accurate peak and average measurements of CW, modulated, and pulsed RF signals at a more cost-effective price point than generally available anywhere else in the industry. Whether it’s a high dynamic range solution or a high frequency solution to 40 GHz, Mini-Circuits offers a power sensor to suit most RF/microwave engineering needs and budgets.
Mini-Circuits’ lineup of entry-level power sensor products capable of CW and true RMS measurements presents an economical option for applications requiring the measurement of CW signals to 8 GHz and modulated or multitone signals to 6 GHz. Both CW and true RMS power sensors and can be found on our main smart power sensors page. For more sophisticated, broader-bandwidth and higher-frequency measurements, Mini-Circuits has extended the capability of the PWR-series with the introduction of the PWR-8P-RC, PWR-8PW-RC, and the PWR-40PW-RC. The performance of these power sensors is summarized in Table 1 and includes the ability to sample and store data to determine average/peak power, crest factor, duty cycle and other statistical information associated with CW, modulated or pulsed signals. All the models in Table 1 offer cost-effectiveness and ease-of-use unparalleled in the test and measurement market.
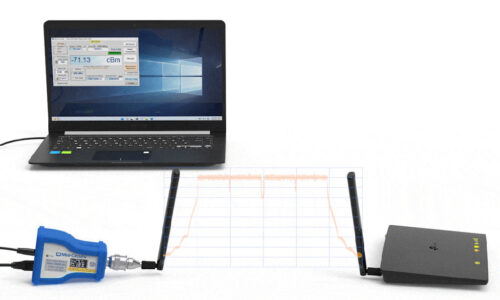
Traditionally, the power sensor (often times referred to as the “power head”) is considered that portion of a power measurement system that attaches directly to the port or test point in the circuit to be measured. The remaining “box” or stand-alone instrument to which the power sensor connects is referred to as the power meter, and performs the processing and display functions. Since modern day USB/ethernet-power sensors essentially perform the sensing and processing on board, utilizing a PC primarily for interface and display purposes, the terms power meter and power sensor have become synonymous, and will be used interchangeably throughout this application note. The final part of the power sensor, the power detector itself, is the integrated circuit utilized directly at the measurement port to initiate the process of measuring the signal. Learn more about power detectors.

The Different Types of RF Power Sensors
Choosing the right power sensor for a given measurement application requires a solid understanding of the measurement methods and capabilities of each type of device. Below is a brief summary of each of the four basic types of power sensors.
CW-Type Power Sensors
CW-type power sensors are limited in bandwidth and are designed to measure very narrowband continuous wave signals. A CW power meter, as the name implies, is specifically designed to measure CW (or continuous wave) signals. CW and average power meters are quite similar, with the major distinction between them being the measurement bandwidth. Since CW signals are inherently narrowband, the measurement bandwidth of a CW power meter is often quite limited. Power measurements are typically made through the use of a pair of diodes (a scaled-down version of a multi-diode path sensor), or through the use of a thermocouple which turns the heat into a voltage. For measurement stability, noise reduction and accuracy, the power readings can be averaged over time, with an averaging count of between 1 and 999. CW signals are most often time invariant
Not Your Average Discussion – The Truth about RMS
There is no such thing as RMS power, and that is the truth. RMS Watts are possible to calculate, but in reality, the result of that calculation is meaningless and irrelevant.1 The RMS voltage or the RMS current is used to calculate the average power.1 RMS, or root-mean-square is defined as the square root of the mean of the square of a function.1 The formula for the root-mean-square of an arbitrary function is shown in Equation (1)1:

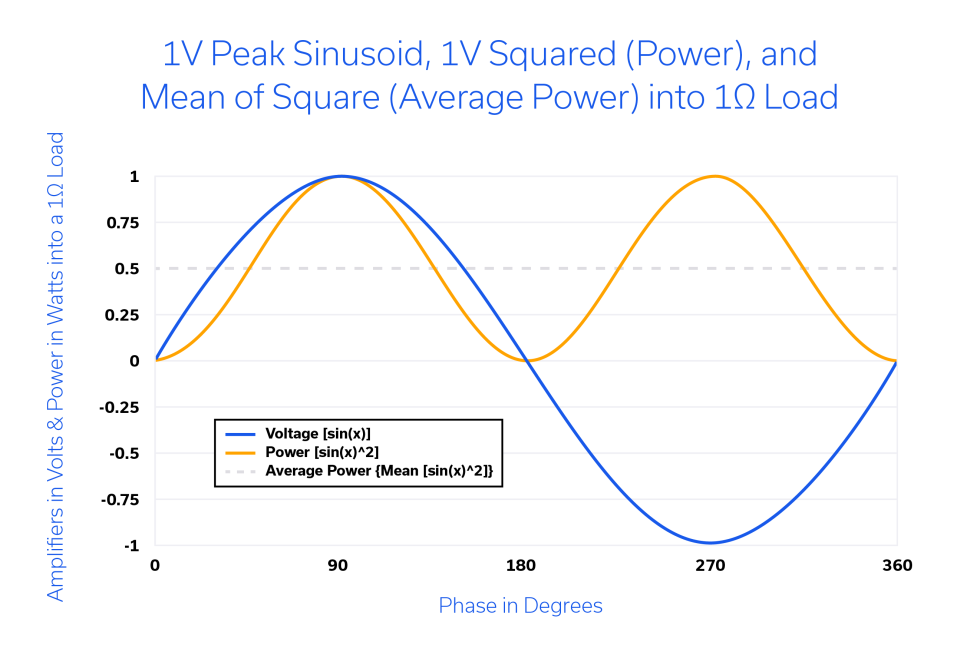
Shown graphically in Figure 1 are:
- A 1V peak pure sinusoidal voltage waveform [sin(x)] represented by the orange curve
- The square of that waveform [sin(x)^2], which is instantaneous power into a 1Ω load, represented by the blue curve
- The mean of the squared voltage waveform, which is average power into a 1Ω load (0.5W), represented by the gray dotted line
The average power for this particular exercise can be determined by inspection, since the instantaneous power waveform is symmetric about its midpoint.
Once the RMS voltage is known, the average power can be determined from:

Often, peak voltage is simply divided by √2, or multiplied by 0.7071 for pure sinusoids to determine the RMS voltage. Unfortunately, it is only sinusoidal waveforms to which this rule applies. For example, replacing f(t) in Equation (1) with the appropriate expression for a triangle wave yields an RMS voltage value that is 0.5774 times the peak voltage, not 0.7071 times. The RMS voltage value of any waveform can be thought of as the equivalent DC voltage that would produce the same average power into the same load impedance as the waveform itself. In other words, RMS is a simple statistical way of representing often complex waveforms. Consequently, any power meter that calculates power based upon only sinusoidal waveforms will introduce errors when attempting to measure signals with some level of distortion or waveforms that are more complex in nature. Power sensors that measure average power based upon having determined the RMS voltage of a waveform will always give accurate results provided the signal remains within the confines of the power sensor bandwidth.
RMS-Type Power Sensors (“true RMS”)
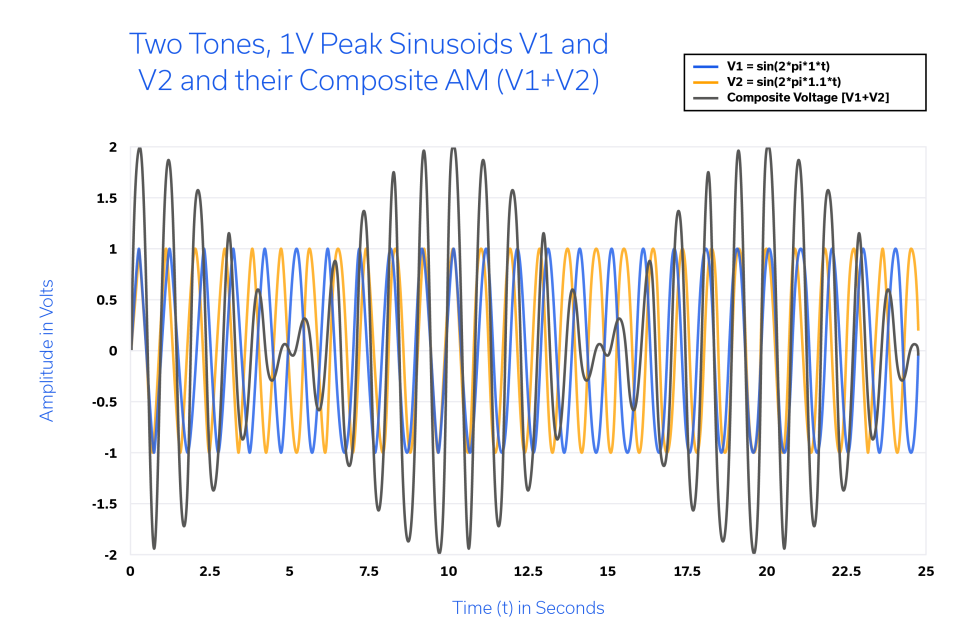
Although “RMS power” is a meaningless term, there is such a thing as an RMS-type power sensor, often called a “true RMS” power sensor because it utilizes the actual RMS voltage to determine the average power. The Mini-Circuits PWR-6LRMS-RC and the PWR-6RMS-RC are two examples of this type of power sensor, and both are capable of measuring the average power of modulated and multitone waveforms. A simple description of a signal that qualifies as both modulated and multitone is shown in Figure 2. For simplicity, the frequency of one signal has been normalized to 1 Hz and the other to 1.1 Hz. The resulting modulated carrier (composite waveform) has a frequency of 0.1 Hz, which is the difference in frequency between the two tones as well as the fact that 2.5 cycles of the AM envelope occur in 25 seconds (T = 10s, f = 0.1 Hz).
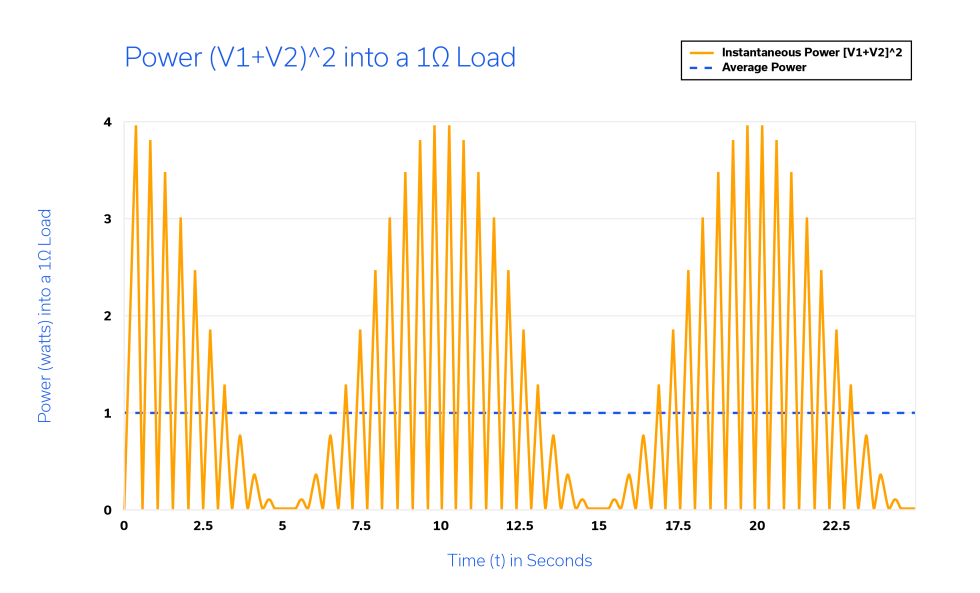
The square of the composite voltage [(V1 + V2)^2] is shown in Figure 3 and, since the load resistance is once again set to 1Ω, the square of the composite voltage is the power delivered to the load. Also shown in Figure 3 is the average power of the modulated waveform. While the RMS (root-mean-square) voltage of the modulated waveform can be determined using Equation (1), and the average power determined in this fashion, it is far simpler to recognize from the discussion of Figure 1 that the average power of a 1V peak sinusoid into a 1Ω load is 0.5W. Since the composite (modulated) waveform is comprised of two such sinusoids, the average power is the sum of both, or 1W.
Peak and Average-type Power Sensors
Sample Rate, Measurement Bandwidth and Memory
Peak/average-type power sensors are far and away the most sophisticated and the most agile. Peak and average power meters, as the name implies, are capable of measuring the peak and average power of most any waveform. To capture the peak power, these instruments take samples (instantaneous measurements) of the input signal at a very high rate and store a large number of these samples in memory. The higher the sampling rate, the greater the measurement bandwidth capability, which means that a peak and average power meter will have a relatively high measurement bandwidth.
The measurement bandwidths for Mini-Circuits’ PWR-8P-RC, PWR-8PW-RC, and the PWR-40PW-RC are shown in Table 1. Recall that the Nyquist criterion requires that the sampling rate be at least twice the highest frequency contained in the signal being measured, or information about the signal will be lost.2 It stands to reason, then, that the PWR-8PW-RC and PWR-40PW-RC have a measurement bandwidth that is 10 MHz and a sampling rate of 20 Msps. Peak and average power meters are also very versatile, since the measurements stored in memory enable calculation of a multitude of waveform statistical characteristics. A peak and average power meter can often determine the shape of a waveform, its power level at a given instant in time, its rise and fall time, and crest factor (Peak-to-Average-Power Ratio, or PAPR).
Take for instance the graph of power vs. time in Figure 3. By inspection, the peak power (Ppk) is approximately 4W. From our previous discussion, we determined that the average power (Pavg), simply the sum of two 0.5W signals, is 1W. Therefore, the PAPR (crest factor) of a two-tone waveform with equal amplitude tones is:

The ability to examine a stored waveform in great detail is particularly important for modern waveforms that utilize complex digital modulation schemes such as QPSK/QAM and OFDM/LTE.
Measurement of Pulsed Waveforms
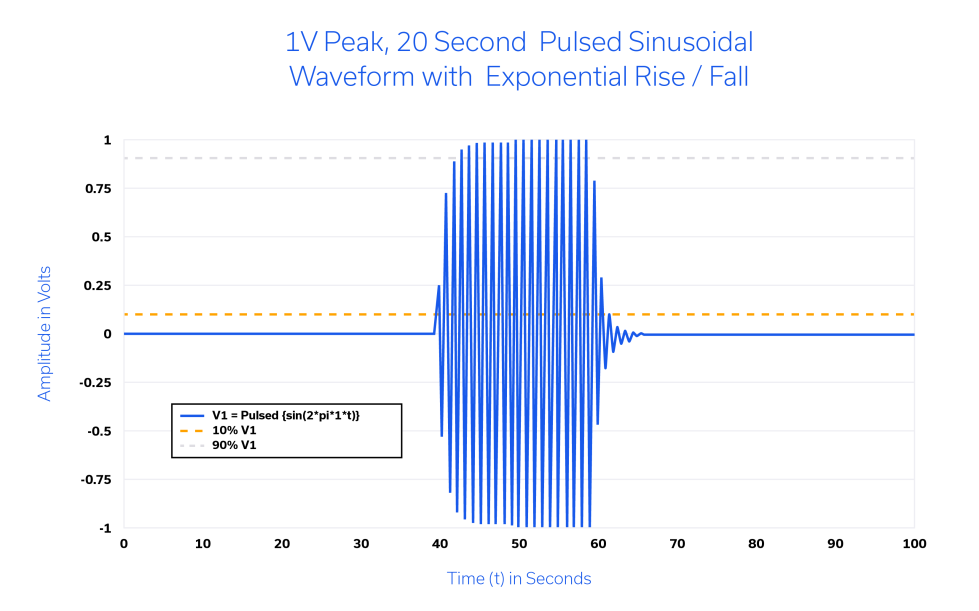
Peak and Average type power meters are also quite effective at measuring pulsed waveforms. A fundamental pulsed waveform is shown in Figure 4. The carrier frequency has been normalized to 1 Hz, and the pulse width is approximately 20 seconds. The rise and fall times have been made exponential, with a time constant equal to 1 second. The rise and fall time (10% to 90% and 90% to 10%, respectively) are both approximately 2.2 seconds. Imagine for a moment that the pulse was 20 µs wide and that the rise and fall times were 2.2 µs. The PWR-8PW-RC power sensor could measure this signal with a carrier frequency up to 8 GHz and the PWR-40PW-RC could handle a carrier frequency up to 40 GHz. Additionally, either of these power sensors would be able to report pulse width, rise time, fall time, duty cycle (if the pulse was repetitive), and peak and average power for a given period.
Both the PWR-8PW-RC and the PWR-40PW-RC have a video output feature that enables the detected pulse envelope or any series of pulses to be examined on an oscilloscope. Clearly the “detector” for the video output waveform provides a positive-going pulse. The video output can also be used as an input to a level control function. Since the assumed 20 µs pulse is sampled at 20 million samples per second (Msps), its amplitude is being recorded every 50 ns, and the pulse amplitude can be examined anywhere along that continuum of samples. Not only can single pulses and periodic pulse trains be examined, but some of the more complex, irregular pulse trains and amplitude modulation schemes can be measured as well. QAM (Quadrature Amplitude Modulation), for instance, can be characterized within a 10 MHz modulation bandwidth. The same can be said of OFDM waveforms such as LTE, given the same 10 MHz measurement bandwidth. The PWR-8PW-RC and PWR-40PW-RC wideband power sensors offer exceptional performance and versatility with a price point that is difficult to find elsewhere in the industry.
In addition to the many established satellite communications bands in the millimeter wave (18-40 GHz) frequency range, the PWR-40PW-RC power sensor has applications that extend to some IEE 802.16 WiMAX bands, all 5G NR2 bands (24-39 GHz), millimeter wave, short-range, fire-control radars, Ka band speed detection radars (33.4-36 GHz), and additional defense applications such as EW, datalink, SATCOM, and radar, which are all competing for additional bandwidth in the 18-40 GHz spectrum.
Power Meter and Power Sensor Critical Parameters
RF Bandwidth vs. Measurement Bandwidth
Becoming familiar with the terminology associated with critical parameters for power meters is key to understanding their functional characteristics. First and foremost, the frequency of operation of a power sensor is often referred to its RF bandwidth. Either term represents the range of RF carrier frequencies over which the sensor is capable of measuring a signal. As shown in Table 1, the PWR-8PW-RC supports measurements of up to 8 GHz and the PWR-40PW-RC up to 40 GHz.
RF bandwidth is not to be confused with the measurement bandwidth capability of the power sensor. The measurement bandwidth is simply how wide (surrounding the carrier frequency, for instance) a frequency spectrum of a modulated signal may be sampled and still be measured accurately. The upper bound on measurement bandwidth is determined by how rapidly a signal waveform is sampled. The measurement bandwidth for Mini-Circuits’ peak and average power sensors is included in Table 1: 100 kHz for the PWR-8P-RC and 10 MHz for the PWR-8PW-RC and PWR-40PW-RC.
As previously mentioned, the Nyquist criterion requires that the sampling rate be at least twice the highest frequency contained in the signal, or information about the signal will be lost.2 The 10 MHz BW of the PWR-8PW-RC and PWR-40PW-RC is right at its Nyquist criterion limit. If an attempt is made to measure a signal that is higher in bandwidth than the measurement bandwidth of the power sensor itself, the power sensor will not be able to sample the signal frequently enough, and will in essence “roll off” the signal and measure a power level that is different from the actual power of the signal. Who would have thought that nearly 100 years after he published his first paper on sampling theory in 1924, we would still be invoking the name Harry Nyquist of Bell Labs as we sample ever more complex signals?2
The PWR-8PW-RC and the PWR-40PW-RC offer the customer the ability to adjust the measurement bandwidth to 10 MHz (full), 5 MHz, 1.5 MHz or 100 kHz with internal filtering. The lower measurement bandwidth settings enable the user to reduce noise when measuring lower bandwidth signals. This bandwidth/noise reduction occurs in the analog domain prior to sampling taking place and is not implemented by a change to the sampling frequency.
Video Bandwidth
To offer comprehensive perspective of the bandwidth associated with the Mini-Circuits’ PWR-series of power sensors, it’s also necessary to introduce the term video bandwidth. Mini-Circuits’ power sensors are versatile, and make a video output available to the customer. This video output port is designed to be connected to another instrument, for instance an oscilloscope, so that the modulation envelope of the signal/waveform can be examined. The video output may also be utilized in an automatic level control circuit. The video output bandwidth of the PWR-40PW-RC, for instance, is 30 MHz.
Rise/Fall Time
The bandwidth at the video output port is closely related to rise and fall time (trise and tfall). The rule-of-thumb relationship between bandwidth and trise/fall is: trise/fall = 0.35/BW. For a video output bandwidth of 30 MHz, trise/fall = 0.35/BW = 0.35/30 MHz ≈ 12 ns. Therefore, the fastest rise and fall time edges for a waveform at the video output port are expected to be approximately 12 ns. The relationship between the highest measurement bandwidth and rise/fall time is not governed by this same rule-of-thumb, but by the sampling rate. The PWR-8PW-RC and PWR-40PW-RC each have a sampling rate of 20 Msps, which yields a sample every 50 ns. 50 ns is then referred to as the sampling interval for these power sensors. As a result, the fastest rise and fall times that can typically be measured are 50 ns, and to achieve a minimum of two samples on the rising or falling edge requires the rise or fall time be 100 ns or greater.
Dynamic Range
The dynamic range of a power sensor is simply the range of power levels over which the power sensor/power meter is capable of accurately measuring and reporting power within the specifications of the instrument. For the 8 GHz power sensors in Mini-Circuits’ lineup (PWR-8P-RC and PWR-8PW-RC), the dynamic range is -60 to +20 dBm and for the 40 GHz model (PWR-40PW-RC) the dynamic range is -20 to +20 dBm.
Sensitivity
Another term that is often utilized when considering dynamic range is sensitivity. This, is simply the minimum power level within the dynamic range of the power sensor, or the minimum level at which the power meter will measure and report signal power levels accurately. In other words, the bottom end of the dynamic range, -60 dBm for the PWR-8P-RC and PWR-8PW-RC and -20 dBm for the PWR-40PW-RC.
Accuracy and Return Loss
Accuracy is, of course the degree to which the power reading at a perfect 50Ω termination is exactly correct. The accuracy of the PWR-40PW-RC is specified to be within 0.4 dB. The return loss of the device under test (DUT) can also affect the measurement accuracy. For instance, if the DUT has a return loss of 12 dB instead of 20 dB, this introduces an additional 0.2 dB of uncertainty into the measurement, effectively worsening the overall accuracy.
Remote Control
All of the power sensors offered by Mini-Circuits are USB-controlled at a minimum, and six models (PWR-6LRMS-RC, PWR-6RMS-RC, PWR-8P-RC, PWR-8GHS-RC, PWR-8PW-RC, and PWR-40PW-RC) are both USB- and Ethernet-controlled.
Choosing a Power Meter/Sensor
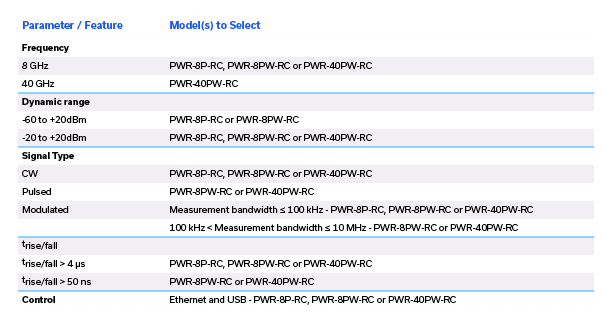
When choosing between Mini-Circuits’ peak and average-type smart power sensors, there are a number of parameters to consider. Table 2 is designed to assist the customer in determining which model is the right choice for the application.
Versatility, Robustness and Cost-Effectiveness
You should now be well equipped to discern between the features and capabilities of different RF power sensors on the market and choose a device that best suits your needs. Mini-Circuits’ PWR-series of power sensors is capable of accurately measuring CW, pulsed and modulated waveforms over a wide dynamic range and at frequencies to 40 GHz. Control is accomplished through the user’s choice of USB or ethernet, as the PWR-series is equipped with both. When combined with the user-friendly software GUI, the PWR-series turns any PC into both a power measurement instrument and waveform analysis tool, yielding a versatile, robust and cost-effective solution to many wideband waveform characterization needs.
Browse Mini-Circuits’ full selection of power meters and power sensors
References
- AGC Systems “There’s No Such Thing as RMS Power!” October 10, 2017 There’s No Such Thing as RMS Power! – AGC Systems
- Analog Devices MT-002 “What the Nyquist Criterion Means to Your Sampled Data System Design” by Walter Kester MT-002: What the Nyquist Criterion Means to Your Sampled Data System Design (analog.com)


