
Peak and RMS RF Power Detectors for High-Frequency Signal Measurement
What Are RF Power Detectors?
Power detectors are widely used RF components that convert an RF input signal into an output DC voltage proportional to the RF input power. Power detectors are useful for a number of applications that include automatic gain control circuits, transmit antenna power monitoring, protecting sensitive circuits from pulses and power spikes as well as a wide range of test and measurement applications. Mini-Circuits has developed different types of high frequency, high accuracy power detectors for these applications. These power detector designs have overcome design challenges at mmW frequencies to enable product features that provide market-leading performance for the price point. These design challenges include improving the input and output matching of the detectors over a wide frequency range in the specified product housing that enables extended dynamic range performance over the operating frequency range compared to competitive models. This article will provide an overview of the different types of power detectors and some of the common applications each is best suited for. Specific use cases for measurement setups will be also presented for each type of detector.
Continuous Wave vs. Modulated Waveforms
This section will provide a general introduction to and explanation of sine wave / continuous wave (CW) waveforms vs. modulated waveforms in the time domain and frequency domain. We will also discuss the difference in time domain and frequency domain signatures of the waveforms.
Figure 1 shows the time domain and frequency domain responses for a CW signal and a modulated signal. In the top-left time domain picture, the CW signal has both a fixed frequency and a fixed amplitude. The x-axis is in units of time (seconds) and the y-axis is in units of amplitude in volts. The top right photo is a fast fourier transform (FFT) of the CW time domain signal in the frequency domain. The x-axis is in units of frequency (Hz) and the y-axis in in units of amplitude in volts. As can be seen from the FFT, the frequency response of the CW signal is a single tone at a single frequency with a fixed amplitude. The bottom left photo is a modulated waveform in the time domain. Here, both the frequency and the amplitude of the signal vary over time. The bottom right photo shows the FFT of this modulated waveform. As can be seen in the FFT, the modulation in frequency and amplitude in the time domain translates to a variation in amplitude and frequency in the frequency domain. From the time domain and frequency domain signatures of the CW and modulated waveforms, it should be expected that different power detector architectures must be used in order to process these different types of time and frequency domain waveforms to produce an accurate DC representation in voltage of the actual waveforms.

Peak vs. RMS Power Detectors
There are fundamental differences between CW and modulated waveforms in both the time domain and frequency domain, as shown in Figure 1 and discussed above. These waveform differences require different types of power detectors to properly convert the RF signal to a DC representation of that signal. For the CW waveform shown in Figure 1, a peak / envelope detector is used to convert the peak amplitude of the CW waveform in time to an output DC value. For the CW signal shown in Figure 1, the envelope is a constant amplitude in time. The peak / envelope detector will convert the peak amplitude of the CW signal to a DC value at the output of the power detector. For the modulated waveform in Figure 1, an RMS power detector architecture is more appropriate to use. In this power detector architecture, the DC output voltage of the detector is an accurate representation of the average signal power of the modulated signal. These types of detectors are suitable for modulated waveforms that have a large peak-to-average ratio (PAR) for the time domain response. In Figure 1, the amplitude of the modulated signal in the time domain can vary significantly, which is a typical characteristic of these types of waveforms. Thus, an RMS measurement of the modulated waveform is more appropriate as opposed to simply measuring the peak of the modulated waveform, as the RMS measurement of the modulated waveform provides a more accurate representation of the waveform than a peak measurement would.
Peak vs. RMS Power Measurement with Mini-Circuits Power Detectors
Mini-Circuits offers two types of detector products up to 40 GHz and beyond. One detector, the ZV47-K44+ is a peak / envelope detector. The ZV47-K44RMS+ is a root mean square (RMS) detector. As described above, the former measures the instantaneous amplitude of the RF input signal and produce an output DC voltage proportional to the amplitude of the RF input signal. This is a characteristic of the peak/envelope power detector transfer function.
As an example of calculating the peak / envelope detector transfer function for the peak / envelope detector, measured data from the ZV47-K44+ data sheet can be used. If the signal into the peak / envelope detector is a CW signal, it can be described as:

Where Apeak is the peak of the CW sine wave and F is of the frequency of operation.
Apeak and F correspond to the frequency and amplitude of the time domain plot and the FFT plot in the top left and right pictures in Figure 1 for a CW signal.
The transfer function for the peak / envelope detector is K (Volts / Vpeak). Thus, the output DC voltage can be calculated using the peak / envelope detector transfer function by the equation:

The output voltage versus input power transfer function for various input frequencies for a continuous wave (CW) input sine wave is shown in Figure 2 for the ZV47-K44+ power detector. Each color in Figure 2 represents a different input CW frequency, and the amplitude of the CW is swept from -30 dBm to +15 dBm on the x-axis. The DC output voltage of the ZV47-K44+ is measured on the y-axis.
From Figure 2, at +15 dBm input power, using the measured curves from the ZV47-K44+ data sheet (OUTPUT VOLTAGE vs. FREQUENCY @ INPUT POWER +15 dBm measured curve), the measured output DC voltage is approximately 3.8V at 10 GHz input CW frequency. The peak voltage for a +15 dBm CW signal can be determined from the following equation:

For +15 dBm input signal power,

This results in:
Using the measured DC output voltage of 3.8V @ +15 dBm CW signal power @ 10 GHz, the peak / envelope detector transfer function can be calculated to be:

As can be seen from Figure 2, the ZV47-K44+ input frequency of operation spans 500 MHz to 43.5 GHz. This extremely wide frequency range of operation allows the ZV47-K44+ power detector to be used in a wide range of baseband, IF, RF, and mmW applications for a variety of markets, including test and measurement and 5G mmW point-to-point solutions. The packaging for the ZV47-K44+ is shown in Figure 3. The power detector comes in a compact, gold over nickel plated brass alloy case (0.84 X 0.96 X 0.37”) with 2.92 mm RF connectors.


The ZV47-K44+ has a higher detection dynamic range, by 4 dB, at 43.5 GHz than competitive models for a ±1 dB error. This extended dynamic range is important for a number of applications, including 5G and mmW test and measurement. For current and future applications, both the frequency of operation and the power levels continue to increase. To measure these increased power levels for components such as a power amplifier at mmW frequencies for 5G, for example, the power detectors must be able to also provide extended dynamic range as well as accurate measurements of these power levels at these frequencies. At the other (lower) end of the power spectrum, in the -40 to -30 dBm power level range, it is desirable to measure these low power levels accurately in the mmW frequency range (small nonlinear errors). Diode detector-based solutions typically do not handle low power levels accurately. From a packaging standpoint, feedback from satellite customers suggests a connectorized component is the preferred packaging approach as opposed to a QFN package. The connectorized module packaging approach provides an enclosure of the power detector and minimizes cross-talk as well as providing improved shielding. The ZV47-K44+ package and performance provide a unique solution to address these issues.
BY contrast, RMS power detectors measure the average signal power of the input signal (RMS) as opposed to the amplitude or peak of the input signal. The DC output voltage of this detector is a representation of that average signal power. The response of this detector is linear-in-dB. Mini-Circuits’ RMS detector, is linear-in-dB with a +29 mV / dB logarithmic slope over a 35 dB input signal dynamic range with an accuracy of ±1 dB over that dynamic range. The ZV47-K44RMS+ is well suited for the measurement of complex waveforms such as OFDM, QAM, and WCDMA where the PAR, or crest factor, can be as large as 12 dB, and can vary during a measurement for the modulated waveform in the time domain.
An example of a modulated waveform was discussed above in Figure 1. The transfer function for the ZV47-K44RMS+ is shown in Figure 4. It should be noted in Figure 4 that the transfer function is for an RMS input signal, not a CW signal as is the case for the ZV47-K44+, the distinction between which was discussed previously. The ZV47-K44RMS+ comes in the same type of package as the ZV47-K44+. Each detector format is suited for the different types of measurements of the different signal types discussed. The ZV47-K44+ can be used in applications where the signals of interest are CW based. The ZV47-K44RMS+ is required for communications applications where modulation schemes are used, such as transceivers for cellular base stations.

The ZV47-K44+ and the ZV47-K44RMS+ have a wide variety of applications and use cases. One test and measurement use case for both detector products is shown in Figure 5. The system shown is an RF transmitter, but the same test methodology applies to an RF receiver as well. The power detectors have been placed along the RF signal path. The addition of these detectors provides built-in-self-test (BIST) capability to the transmitter. With the addition of these detectors, several transmitter characteristics can be measured, including the nominal room temperature RF gain along the RF signal path as well as the temperature performance of the RF signal chain. This capability allows the RF transmitter gain versus temperature to be known, and the measured data can be used to adjust for RF transmitter gain errors over temperature. If any of the RF blocks have either analog or digital adjustability for these gain errors, the information provided by the DC output voltages of the power detector can be digitized by an ADC and the measured data can be used in a digital calibration loop in conjunction with this digital adjustability to correct for these gain errors over temperature.

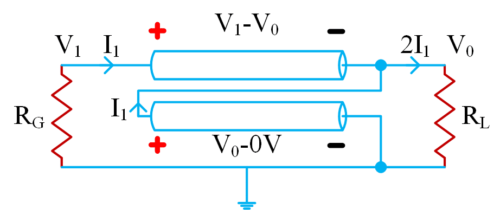
Another application of the power detectors is shown in Figure 6, which depicts a section of an RF receiver. In this application, the ZV47-K44+ or ZV47-K44RMS+ power detector is used to monitor the mixer output power. The DC output voltage of the power detector is converted into a current by the resistor at the input to the integrator. This current is defined by the difference between the DAC voltage VDAC and the detector output voltage divided by the resistor value. The output voltage of the integrator goes into a voltage variable attenuator. The variable resistive attenuator will adjust its value over time until the mixer output power is at the expected signal power level, set by the DAC voltage VDAC. This circuitry forms an automatic gain control (AGC) loop around the receiver, and it controls the mixer output power through the action of the AGC feedback. The mixer output power will increase or decrease as the DAC voltage VDAC is increased or decreased.

There are many useful applications that can take advantage of the capabilities the power detectors presented here provide. The peak / envelope detector can be used in any mixed signal / analog / RF application above 500 MHz to measure the amplitude of the signal in the signal chain. The detector can also be used for pulse detection in a pulsed system, and to calibrate LO feedthrough for quadrature modulators. The RMS detector can also be used in the same situations to measure modulated waveforms instead of CW signals.
For further information about the ZV47-K44+ and ZV47-K44RMS+ for your application, browse our full selection of RF power detectors or contact Mini-Circuits applications engineering.